When asked how to aggregate data in Qlik products in the quickest way, the answer is "it depends". While the key factor is the uniqueness/ cardinality of the aggregating dimensions, there are other elements at play.
In general, though, the fastest way to aggregate in the data load script (after loading the data into memory) is:
- When aggregating by a low cardinality dimension in a small data set, resident load and run a group by immediately (this is also the fewest lines of script)
- When aggregating by a higher cardinality dimension, or on one that requires a lot of sorting prior to aggregation, resident load and sort the table by the high cardinality dimension as the first step. Then resident load this table and run your group by as a second step.
The short version: use approach 2 as the default, unless your data is very simple.
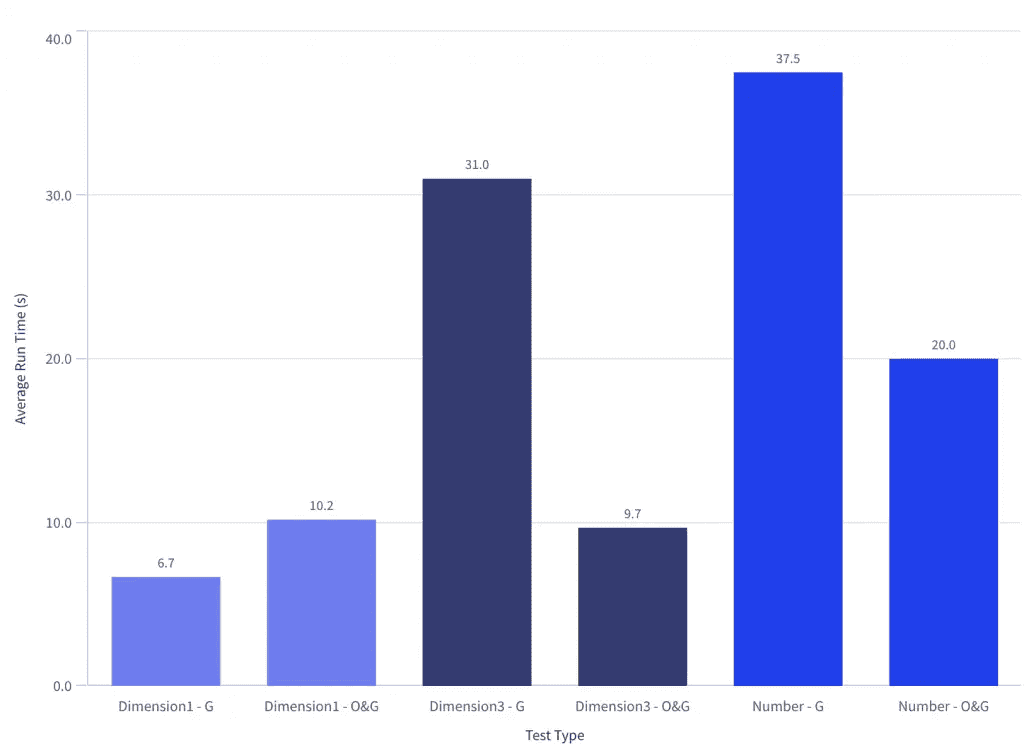
For Dimension1 (low cardinality), a direct group by (G) was fastest. For Dimension3 (high cardinality) and Number (low cardinality) an order by, then group by (O&G) was fastest by a large margin
The Test
Using a 2 core 8GB RAM virtual machine in Azure, we loaded 5 million rows of randomly generated data from a QVD (which was then loaded using an optimised load). The test is run 5 times per test, with the average used for analysis.
This data came from the random data generator script posted earlier this year. The script used to run the test can be found on Github.

The aggregations were tested on Dimension1 (low cardinality), Dimension3 (high cardinality) and Number (low cardinality)
The tests below explores the statement that it can be significantly faster to load data, sort it, then group it (three steps) rather than just loading and grouping it (two steps).
Tests:
- "G" - Group by (load data from QVD, then group in resident load)
- "OG" - Order by, group by (load data from QVD, then sort in first resident load, then group in second resident load)
Test cases:
- Dimension1 - this is a single upper case letter field (26 possible values). The values are in a random order
- Dimension 3 - this is a four letter letter, both upper and lower case. The values are in a random order
- Number - this is an integer between 1 and 26, which increments to 26 before resetting to 1 and repeating the increment across the data set
The Results
Order by, then group by is fastest in more complex data sets
With the exception of the simple alphabetic field (Dimension1), it is significantly faster to first sort the data, then aggregate it when doing so on a single dimension field.
This means more script in your app - but a faster overall load.
Future questions
To explore at a later date:
- Was it the sort order or the data type that resulted in such a large difference between Dimension1 and Number, as both had 26 unique values?
- Where is the crossover in terms of dimension complexity between the O and O&G approaches?
- How does performance change when grouping by a number of dimensions rather than just one?
- How does peak RAM and CPU differ between the tests?
- Does a preceding load offer similar performance benefits (in which case you'd also benefit from less code)