Generally, getting access to vehicle data is a pay-for-data experience - but snapshots are released each year to the public.
If you head to the Vehicle Statistics page on gov.uk you get statistics about vehicle licencing, excise duty evasion, vehicle roadworthiness testing and more. You'll probably want to check out the index as there's 76 files in the 2016 download alone, at various levels of granularity...
The one I'm going to look at today though, is:
Licensed Cars, Motorcycles, Light Goods Vehicles, Heavy Goods Vehicles, Buses and Other vehicles by make and model, Great Britain, annually from 1994, quarterly from 2008 Quarter 3 ; also United Kingdom from 2014 Quarter 4
AKA table VEH0120. Interestingly, Qlik Sense throws an "Unknown Error" message when trying to load ".ods" files so I converted it to Excel prior to loading.
Loading the data
As seems to be the case with most data from gov.uk, the data isn't in the best format for machine ingestion.
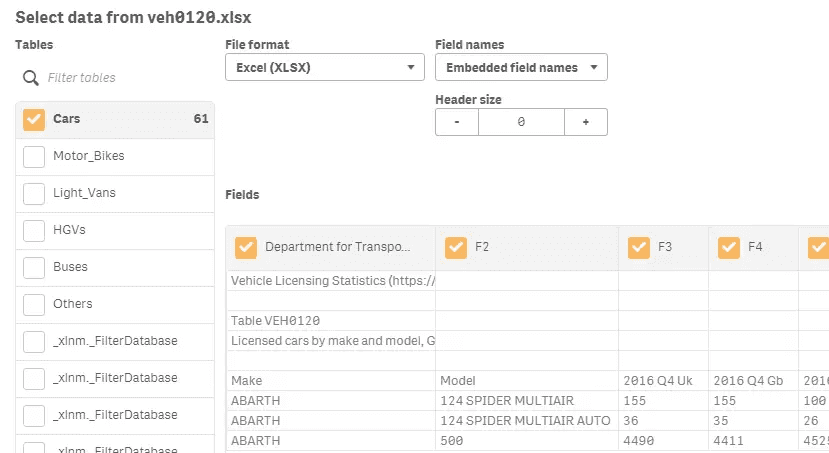
Multiple tabs and header rows require a bit of tweaking in Sense, the data will need formatting in Sense
Not a huge problem however, as I'm interested in cars only (so a single tab), and I can clean the rest up with the data load editor and a header size of 6.
To bring in all the quarters, I'm going to crosstable the data with Crosstable(Period, Vehicles, 2) to provide a format we can work with. The resulting data will be left in a flat table as it's not an issue with these data volumes.
// Load raw table from xlsx
Raw_VehicleStats:
LOAD
 Make,
 Model,
 "2016 Q4 Uk",
 ...,
 "1994q4"
FROM [lib://VehicleLicencing/veh0120.xlsx]
(ooxml, embedded labels, header is 6 lines, table is Cars);


// Transform this into a crosstable
Temp_VehicleStats:
Crosstable(Period,Vehicles,2)
Load
 *
Resident Raw_VehicleStats;

// Drop raw data table
DROP TABLE Raw_VehicleStats;


// Load final version of table
VehicleStats:
NoConcatenate
Load
 *,
 UPPER(Make & ' ' & LEFT(Model,INDEX(Model,' '))) AS [Make and Model],
 LEFT(Period,4) AS Year,
 RIGHT(Period,2) AS Quarter;
Load
 Make,
 Model,
 UPPER(LEFT(REPLACE(Period,' ',''),6)) AS Period,
 Vehicles
Resident Temp_VehicleStats
WHERE WildMatch(Period,'*q4*') // Include only Q4 as years prior to 2009 do not have the other four quarters
AND Not WildMatch(Period,'* Uk'); // Exclude the later duplicated records (GB vs UK)

// Drop temp data table
DROP TABLE Temp_VehicleStats;
I've also removed data to keep only data relating to Gb and Q4 as prior to 2009 this was the only data available in the file. The resulting QVF is around 1.4MB.

DfT Logo in 8:5
I also added a DfT logo in 8:5.
What does the data look like?
There's a few data quality issues, mainly related to data capture. Have a look at the chart below - BMW and Mercedes appear to have hundreds of discrete models on the road, however when you delve into it you find that every engine level of each BMW model is listed (instead of BMW 1 series, it's 114d, 114i, 115i, 116i, etc). Meanwhile, makes like Ford have Fiesta, Focus, Mondeo, etc.
To open this fullscreen, click here.
When looking at the annual tallies for 2016's top 10 makes, unsurprisingly the big names are all there (Ford, Vauxhall, Volkswagen...).

Vehicles on the road for 2016's top 10
Ford, Peugeot, Renault and Citroen have all taken a tumble, or remained static (against a backdrop of increasing cars on the road), while VW, BMW, Audi, Toyota, Nissan and Mercedes have all increased consistently over the period.
But what about the old names - who's not in this picture if we look at this from 1994?

Vehicles on the road for 1994's top 10
Rover, Austin and Volvo are the main losers here, the rest of the list remains the same as 2016 (which replaces the names above and Citroen with Mercedes, Toyota, BMW and Audi).
Unfortunately I couldn't embed these charts as Qlik Cloud currently won't display them for sharing, hence the still images in the post. Hopefully we'll be back to interactivity next time.