I've had a copy of some of the Highways Agency data downloaded for about a year - so it was time to have a quick look at it.
I'm going to quickly load a single month into Tableau Public and Qlik Sense Cloud (the CSVs are approx 850MB per month) to look at some basic mapped traffic flow information.
The data
The data in this post comes from the Highways Agency journey time and traffic flow data on the data.gov.uk website. Unfortunately this data stops at the start of 2015 (data from then on is incomplete) and is now available via the webtris system APIs, although this post looks at data from March 2012.
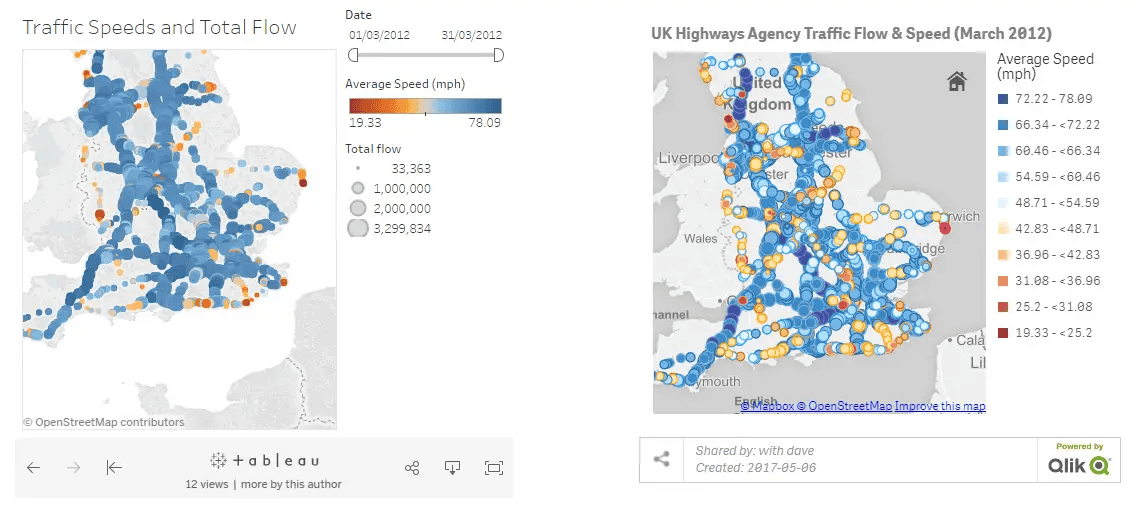
Tableau Public vs Qlik Cloud Maps
Visualising with Tableau Public 10.2.1
A single CSV was loaded in to provide the month's data, and a lookup file with relevant lat/lon was left joined to the data.
>>No longer available.
I'll tidy this up in another post and add some analysis to it, but for now, I'm going to simply compare this to Qlik Sense Cloud.
Visualising with Qlik Sense Cloud
The same process was followed as per the Tableau vis, with the exception that instead of tagging fields as lat/lon, the GeoMakePoint function was used to create a suitable GeoPoint.
What's next
Next up on my list:
-
Reorder the measures
-
Load further data, display time series analysis
-
Add in traffic incident data (does slow traffic correspond to an incident or volume)
-
Identify road capacity at which speed drops (saturation point)