Previously, I tested the performance of a load script while using RecNo() and RowNo() functions. This conveniently gave me a script which consumes up to 25GB of RAM, along with considerable CPU power.
So, what about testing it on two cloud boxes? I've chosen a machine from both AWS and Azure, loaded them with Qlik Sense September 2018 and run the load script.
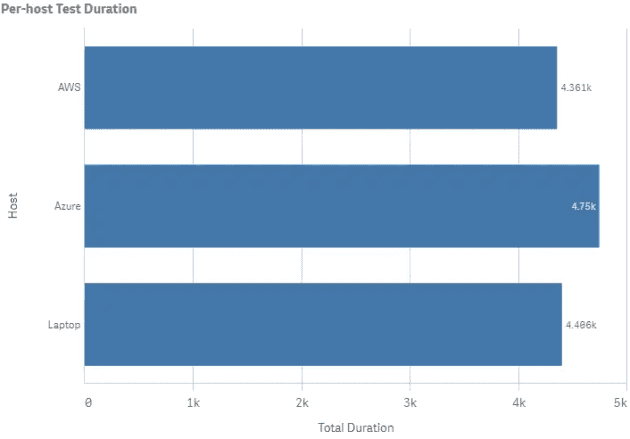
Total Test Duration by Host
The summary: The AWS box was approx 8% faster than the Azure box.
The data
The data set being used is the same as for an earlier post on RecNo() and RowNo(), namely the comments data from StackExchange.
The servers
What I've aimed for here is two servers with similar specifications and cost (at face value). I haven't taken into account other factors such as IOPS or "ECU". The only software installed on these servers is Qlik Sense and Google Chrome. I've also included a laptop for comparison.
AWS VM
VM Size: t2.2xlarge
Type: Standard
CPU: 8 vCPU (Intel E5-2686v4 @ 2.3GHz)
RAM: 32GB
OS: Windows Server 2016 Datacenter
Approx Monthly Cost: ~£270 ($0.4844 per Hour)
Azure VM
VM Size: D8s_v3
Type: Standard
CPU: 8 vCPU (Intel E5-2673v4 @ 2.3GHz)
RAM: 32GB
OS: Windows Server 2016 Datacenter
Approx Monthly Cost: £266.16
Laptop
CPU: 2 core/4 thread (Intel i7-6600U @ 2.6GHz)
RAM: 32GB
OS: Windows 10 Professional
Note that the CPU speed is as reported by Windows Task Manager.
In a production deployment on either AWS or Azure, we might expect a multi-server architecture, and also utilisation of platform specific technologies such as Azure Files for the fileshare.
The results
I had no expectations coming into this, as both of these are general servers (i.e. not specialised for memory or compute) and are in the same price bracket.
Per-host results
Overall, it's AWS>Laptop>Azure. Presumably the higher clock speed on the laptop offsets having 1/2 the cores.
As for AWS vs Azure? It could be the way the infrastructure is configured, the utilisation of other VMs on the same host, also possibly the difference between the 18 core 2686 on AWS and the 20 core 2673 on Azure.
Total Test Duration by Host (total duration in seconds)
Per-test results
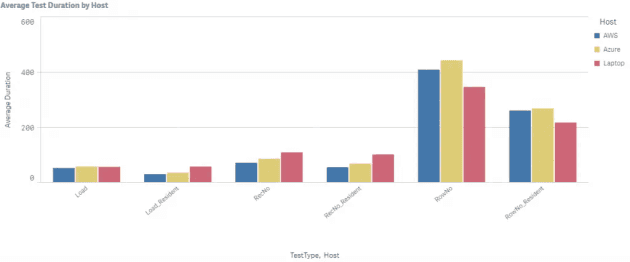
The per-test results are interesting, with some notable variances:
- The laptop kills it on RowNo, but not on RecNo (this is what puts it into second place overall)
- Azure suffers across the board compared to AWS
Per-host test results (average duration in seconds)
Iteration results
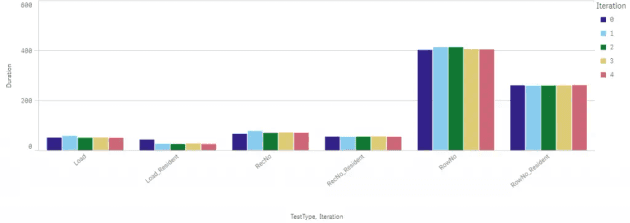
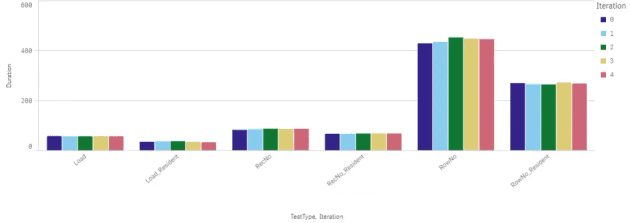
Comparing the actual per-test results, they are generally consistent on both servers - which you'd expect from a brand new box.
AWS has a few noticeable variations in the shorter tests.
Iteration Results - AWS
Azure has some more obvious variations in the longer tests.
Iteration Results - Azure


